When trying to optimize a page, we’ll often look at the weight of the page, and how long the browser takes to download the necessary assets. But in addition to how long it takes to download the asset, it’s also valuable to check how long it takes to evaluate and execute it, especially when it comes to our JavaScript files.
Each script we use is going to have a cost associated with it, including a download cost and an execution cost. And both of these can impact our page’s performance. The execution cost is especially important when it comes to mobile devices. Overall, they will have far less resources and power to handle parsing and executing scripts than non-mobile devices. Which means a small, minified, script that doesn’t take that long to download, could still make a significant impact on the page’s performance if it requires much work to parse and execute–especially on lower-end devices.
Checking Evaluation and Execution Costs
So how do we see what these evaluation and execution costs are?
In Chrome, if you open up DevTools, you can find some useful tools under the ‘Performance’ tab. Here, if you hit the ‘Start profiling and reload the page’ button, it will reload the page and keep track of important stats.
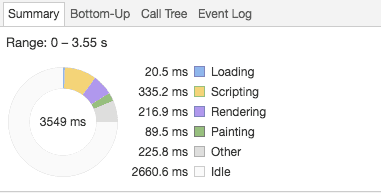
For instance, at the bottom, there is a ‘Summary’ tab that will give you an overview of the various aspects of loading the page.
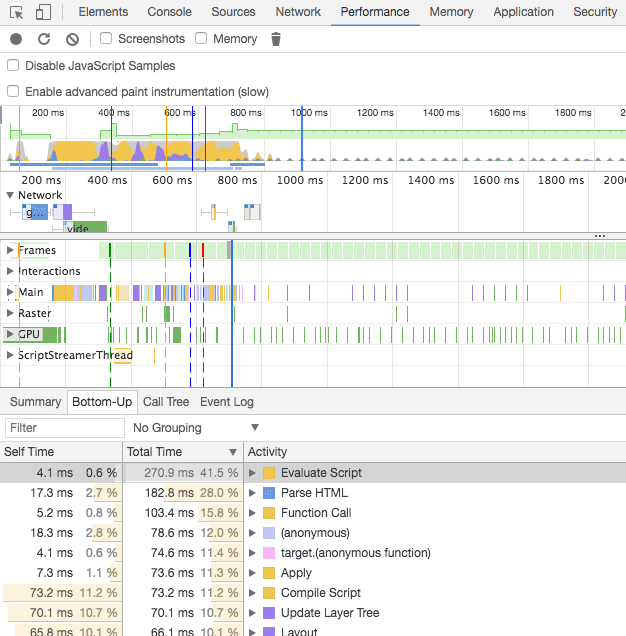
Especially helpful is the ‘Bottom-Up’ tab right beside it, which will give you a detailed look at all the elements that make up the summary. This can help identify, for instance, how long it takes to evaluate individual scripts, and how long each one takes to execute.
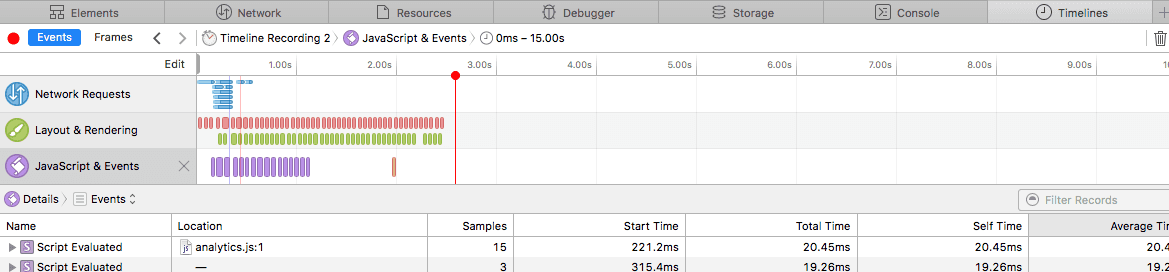
For similar information in Safari, you can go to the Timelines tab within Inspector. If the red recording button is already selected, you can simply reload the page, and it will begin recording performance related stats, with a timeline at the top, and details below. This can allow you to see if certain scripts are taking longer than expected, and can help pinpoint potential performance issues.
Comparing Mobile and Desktop
Looking at these performance tabs can be helpful to get an overall idea of how things are going, but how does this relates to what actually happens on a phone? Here is where doing some remote debugging can be helpful.
I was curious how much the difference actually was, especially when it came to evaluating and executing scripts, so I connected an iPhone to my laptop and used Safari to connect to it remotely. I then pulled up the same page on both devices to see what the differences were for evaluating and executing the various scripts on the site. And while I expected there to be some difference, I didn’t realize how big a difference I would see.
(Note: I was using an iPhone 5c for this test–definitely not new, but also more powerful than some devices out there).

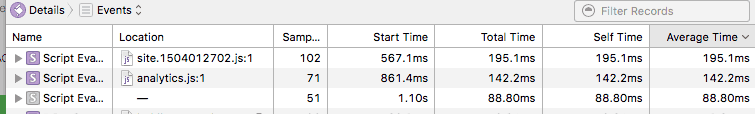
I noticed that in some cases evaluating the same script could be well over 5x slower on a phone. I tried this on other sites, and the slowdown was usually somewhere in the 2-10x range, with over 5x not being uncommon.
Using the Throttle
Knowing this can be helpful when building a site. Some issues that may not be noticeable on our development machines, may become big issues on a mobile device.
One way to catch these potential problems early is by choosing to throttle the CPU on your desktop when testing a site. This will emulate the additional time it would take for a phone to process the page, giving you a better idea of how it would perform in that environment.
In DevTools, in the ‘Performance’, there is a ‘CPU’ option you can use to emulate a slower CPU.
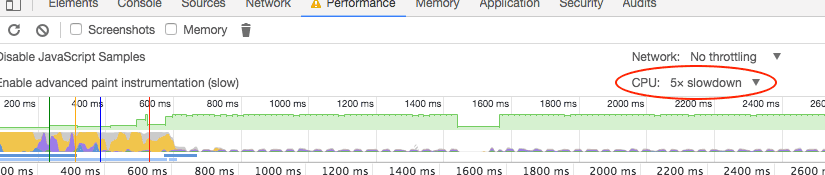
Based on my experience, 5-10x isn’t a bad place to start if want an idea of how things will execute on lower-end devices. (The same could be done for the ‘Network’ option if we wanted to simulate slower network speeds).
More than Download Times
Download times are important, but so is the evaluation/execution costs of any JavaScript on the page. Neglecting these can lead to performance issues, but being mindful of them can help us provide a better experience to all the visitors to the page—including those on less performant devices.