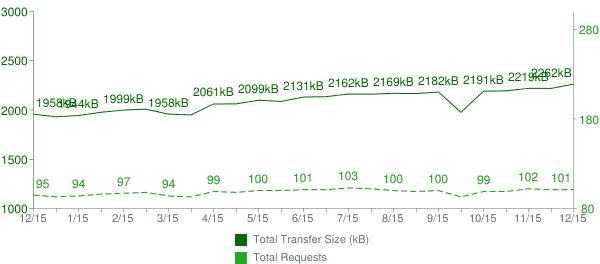
Another year has passed, and according to HTTP Archive the “average” page weight of the top 500,000 websites continues to increase. A year ago, at the end of 2014, the “average” page was 1,953 kB. A year later, at the end of December 2015, it was 2,262 kB, a 16% jump. Unsurprisingly, the use of Flash dropped, but the weight of every other type of content (HTML, CSS, JS, images, etc.) went up.
What contributed most to this jump? According to the stats, the biggest part of the increase was due to images, accounting for 1,443 kB and 55 requests on the “average” page. The next largest content type was JavaScript, averaging 363 kB and 22 requests per page.
What is “Average” Anyway?
I’m putting the term “average” in quotes because the term is not always the most helpful. It assumes a relatively normal distribution, but in the world of web pages, this often isn’t the case. Recently, Ilya Grigorik wrote about the myth of the “average” page, and provided a variety of helpful charts that showed the actual distribution of various content types.
Other Developments
Although there may be no perfect “average”, it does seem, in general, that we’re not not seeing significantly better performance across the board. And it was this continuing lack of performance that played a part in some of the developments of this past year. Specifically, Facebook’s launch of Instant Articles, and Google collaboration with several publishers on the Accelerated Mobile Pages Project (AMP), were both projects that addressed the fact that users want a better web experience—especially when it comes to consuming content on mobile.
And it’s the user’s experience that’s ultimately most important. Even if our web pages are under the so-called “average” page weight, that doesn’t mean we’ve done our job. The goal is to do what we can to keep them lean and as performant as possible. Which, as we can see, entails much more than just doing better than “average.”